Dashboard Sections
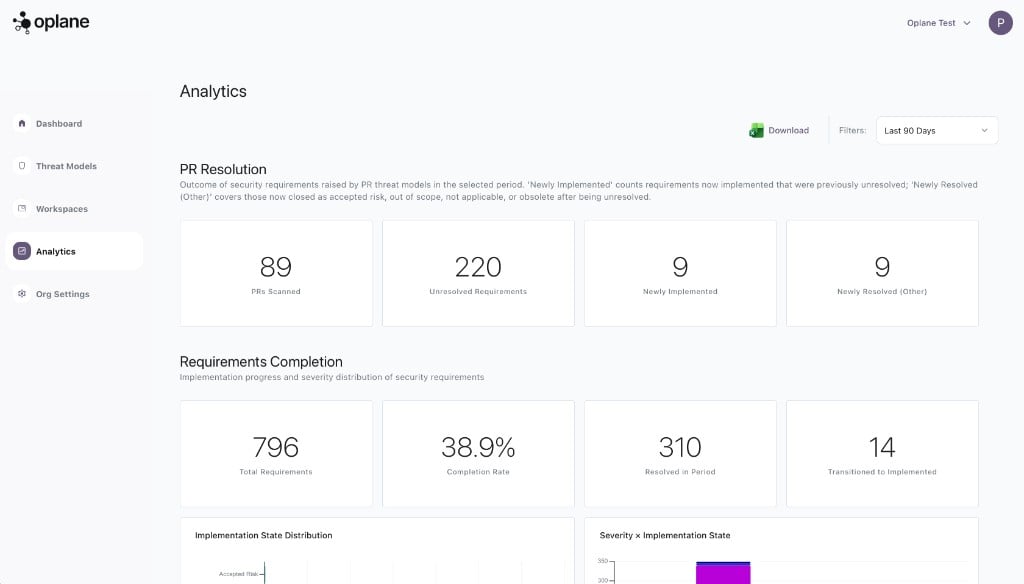
PR Resolution
Tracks the outcome of security requirements raised by PR threat models in the selected period. Shows how many PRs were scanned, how many unresolved requirements remain, and how many were newly implemented or resolved.- PRs Scanned — Total pull requests analysed
- Unresolved Requirements — Requirements still open
- Newly Implemented — Requirements that moved to implemented
- Newly Resolved (Other) — Closed as accepted risk, out of scope, or not applicable
Requirements Completion
Implementation progress across all security requirements in your organisation:- Total Requirements — All requirements generated
- Completion Rate — Percentage resolved (implemented + accepted risk + out of scope + not applicable)
- Resolved in Period — Requirements resolved in the selected time window
- Transitioned to Implemented — Requirements that moved from unresolved to implemented
Adoption
Measures how many repositories in your organisation have threat modeling enabled:- Covered Repos — Repositories with active managed workspaces
- Uncovered Repos — Repositories without threat modeling
- Onboarded in Period — Newly connected repositories
Threat Model Sources
Shows where your threat models come from:- PR Analysis — Generated automatically from pull request reviews
- Agent (MCP) — Created manually via MCP in your IDE
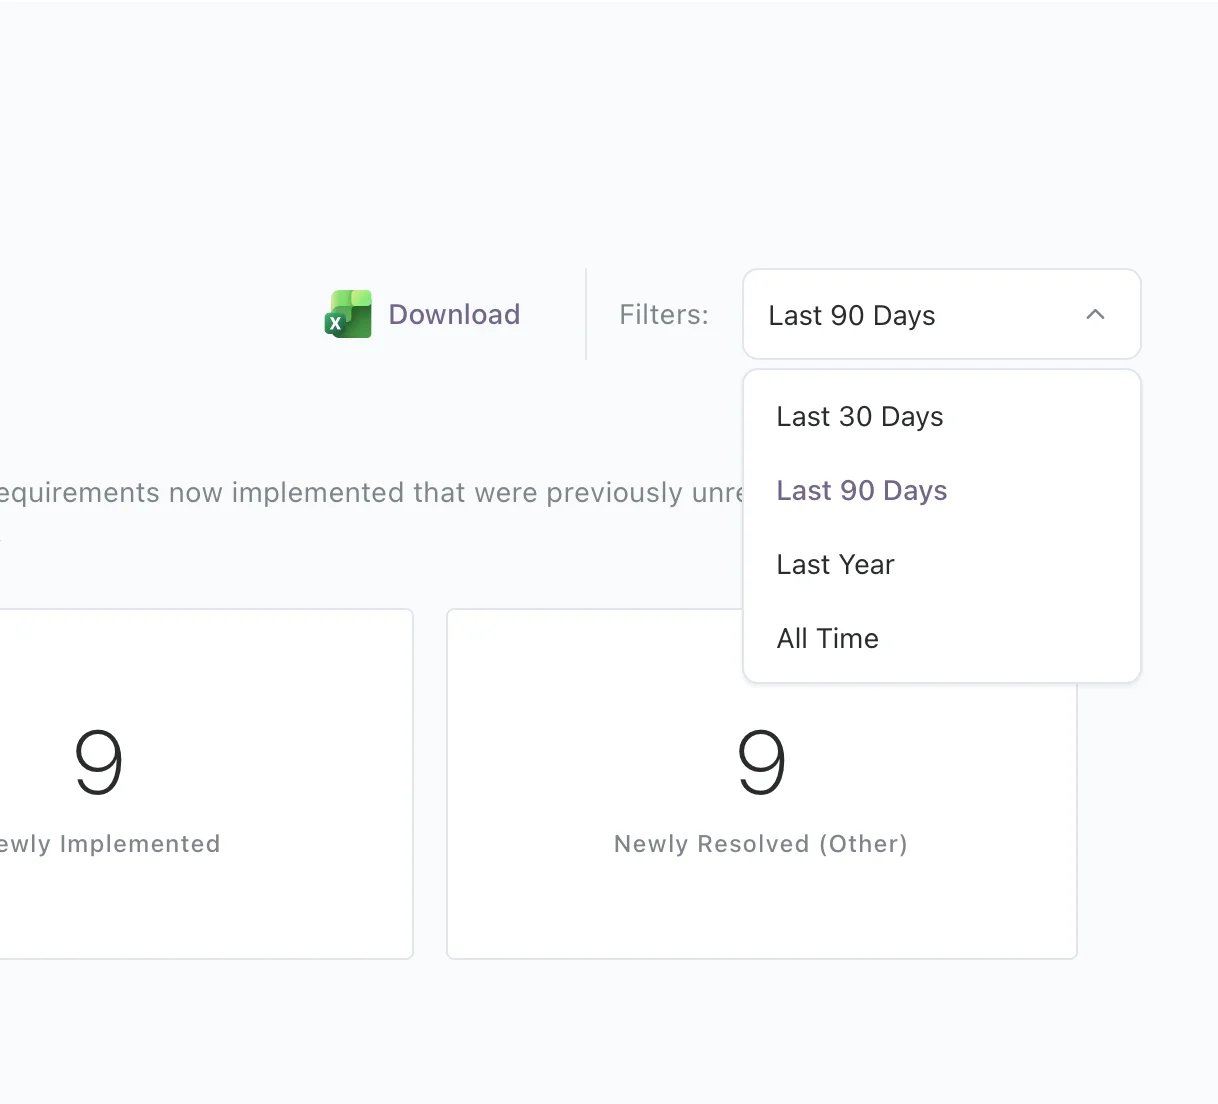
Filtering
Use the time period filter in the top right to adjust the dashboard view:- Last 30 days
- Last 90 days
- Last year
- All time